
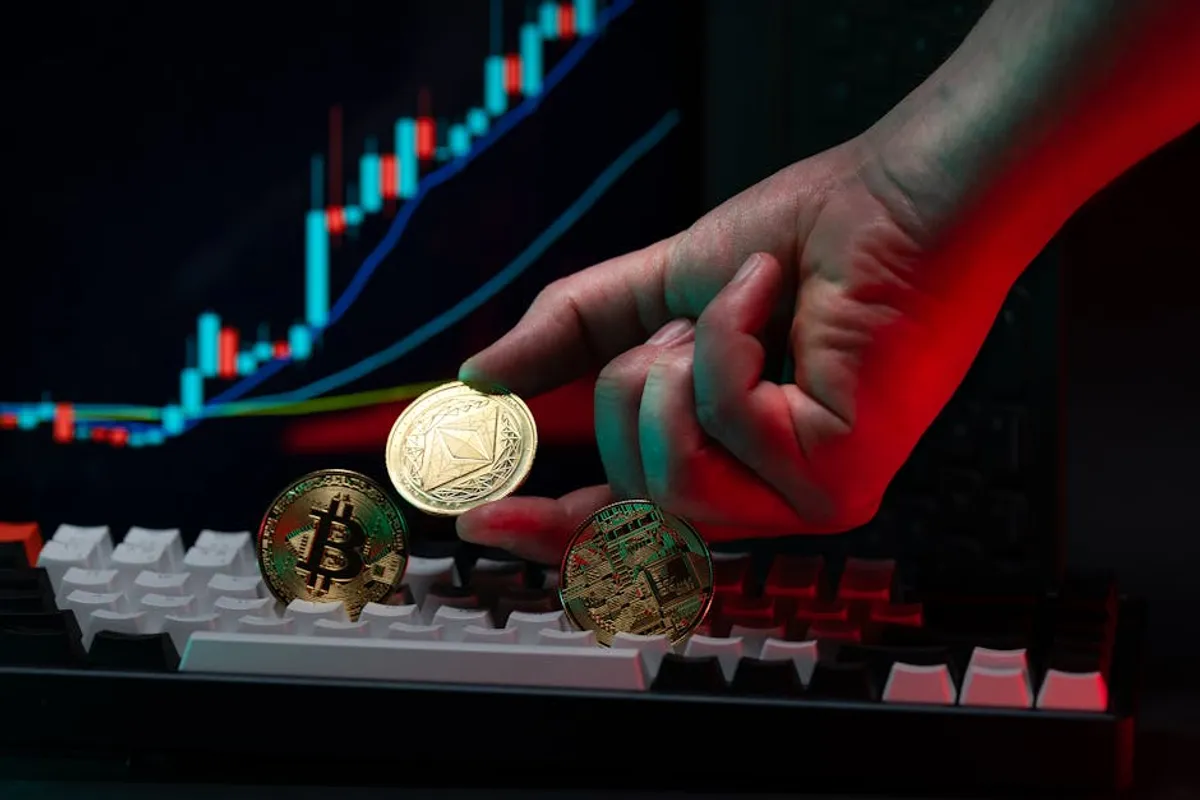
Navigating the cryptocurrency market requires more than simply observing a ticker price. Each price update, whether from a news aggregator or a trading platform, contains layers of data that, when understood, provide a clearer picture of market sentiment, liquidity, and potential future movements. For marketers, investors, and publishers, deciphering these data points is crucial for identifying trends, understanding audience interest, and making informed content or investment decisions.
Understanding Core Metrics in Price Updates
When reviewing crypto price updates, look beyond the immediate number. Several key metrics offer immediate context:
- Current Price: This is the most visible metric, representing the last traded value. However, without context, it’s merely a snapshot. Its significance emerges when compared to historical data or other assets.
- 24-Hour Change (% and Absolute): This indicates the percentage and absolute price movement over the past 24 hours. A significant percentage change signals volatility and strong short-term sentiment, either positive or negative. For example, a +15% change suggests rapid accumulation or positive news impact, while a -10% change points to selling pressure or adverse developments.
- 24-Hour High/Low: These figures define the price range within a single day. The high represents the peak price reached, while the low marks the floor. These can serve as immediate indicators of support and resistance levels. Repeatedly hitting the high suggests upward momentum, while frequent tests of the low indicate potential further decline.
- Trading Volume (24-Hour): This metric quantifies the total value of a cryptocurrency traded within the last 24 hours. High volume accompanying a price movement suggests strong conviction behind that move. For instance, a price surge on high volume is generally more sustainable than a similar surge on low volume, which might indicate a temporary fluctuation or manipulation. Conversely, a price drop on high volume signals significant selling pressure.
- Market Capitalization: Calculated by multiplying the current price by the circulating supply, market capitalization (market cap) represents the total value of all circulating coins. It's a key indicator of a project's size and relative dominance within the broader crypto ecosystem. Larger market caps often imply greater stability and liquidity, though not always.
- Circulating Supply vs. Total Supply: Circulating supply refers to the number of coins currently available to the public. Total supply is the maximum number of coins that will ever exist. Understanding the difference helps assess scarcity and potential future inflation or deflation. A low circulating supply relative to demand can drive prices up, while a large, unlocked supply might create selling pressure over time.
Interpreting Price Charts and Timeframes
Raw numbers provide data points; charts visualize the narrative. Learning to read charts is essential for understanding price action over time.
Candlestick Charts
Candlestick charts are standard for visualizing price movements. Each "candlestick" typically represents a specific time interval (e.g., 1 hour, 1 day, 1 week) and shows four key pieces of information:
- Open: The price at the start of the interval.
- High: The highest price reached during the interval.
- Low: The lowest price reached during the interval.
- Close: The price at the end of the interval.
The "body" of the candlestick (the thick part) indicates the range between the open and close prices. A green (or white) body usually means the closing price was higher than the opening price (a gain), while a red (or black) body means the closing price was lower (a loss). The "wicks" or "shadows" (the thin lines extending from the body) represent the high and low prices reached during that period. Long wicks can indicate significant price rejection or volatility.
Timeframes
The chosen timeframe dramatically impacts the interpretation of a chart. Short-term charts (e.g., 1-hour, 4-hour) reveal immediate market sentiment and intraday volatility, suitable for day traders or rapid news analysis. Longer-term charts (e.g., daily, weekly, monthly) smooth out short-term noise, highlighting broader trends and overall market direction. A daily chart might show an upward trend, even if a 1-hour chart shows a temporary dip. Always consider multiple timeframes to gain a comprehensive perspective.
Volume Bars
Volume bars, usually displayed below the price chart, correlate directly with each candlestick. Taller volume bars indicate higher trading activity during that period. When significant price movements (up or down) are accompanied by high volume, it suggests strong market conviction. Conversely, price movements on low volume are often less reliable and may indicate a lack of broad market participation.
Pro Tip: Never rely on a single metric or a single timeframe for making assessments. A holistic view, combining price action, volume, and market capitalization across different timeframes, provides a more robust understanding of market dynamics and reduces the risk of misinterpretation.
Key Indicators Beyond Raw Numbers
While core metrics and charts provide a foundation, other indicators offer deeper insights into market mechanics and sentiment.
Order Books: These display the current buy (bid) and sell (ask) orders for a cryptocurrency at various price levels. The "depth" of the order book shows the amount of liquidity available at different prices. A thick order book with many bids below the current price suggests strong support, while many asks above indicate resistance. A wide bid-ask spread suggests lower liquidity and potentially higher volatility.
Funding Rates (for derivatives): For perpetual futures contracts, funding rates are periodic payments exchanged between long and short traders. Positive funding rates mean longs pay shorts, indicating a bullish sentiment in the derivatives market. Negative rates suggest bearish sentiment. These rates can offer a glimpse into the leverage-driven sentiment that often precedes significant price moves.
On-Chain Data: This refers to data directly from the blockchain, such as transaction counts, active addresses, and the movement of large holdings ("whale" activity). While requiring more specialized analysis, trends in on-chain data can sometimes precede price movements, indicating fundamental network health or significant shifts in ownership.
News & Sentiment: External factors, including regulatory announcements, technological developments, partnerships, and even social media trends, significantly influence crypto prices. A critical part of reading price updates involves correlating price movements with relevant news events and overall market sentiment.
Synthesizing Information for Informed Decisions
Effectively reading crypto market news means integrating various data points into a coherent narrative. It's about developing a critical framework for analysis:
- Always check multiple, reputable data sources to cross-verify information and ensure accuracy.
- Understand the underlying project's utility, technology, and roadmap. Fundamental strength often underpins long-term price stability.
- Distinguish between short-term market noise (daily fluctuations) and long-term trends. Volatility is inherent, but sustained trends reveal broader market direction.
- Avoid making decisions based solely on emotional responses like fear of missing out (FOMO) or fear, uncertainty, and doubt (FUD). Data-driven analysis is paramount.
- Focus on how volume supports or contradicts price movements. A price increase without corresponding volume is often unsustainable.
- Recognize that price is a reflection of current supply and demand, influenced by myriad factors, not necessarily a direct indicator of intrinsic value.
By consistently applying these principles, you can move beyond superficial price observations to a deeper, more actionable understanding of the crypto market's dynamics.
Frequently Asked Questions
What is market capitalization and why does it matter?
Market capitalization, or market cap, is the total value of all circulating units of a cryptocurrency. It's calculated by multiplying the current price per coin by the number of coins in circulation. It matters because it provides a measure of a project's size and relative standing in the market, often correlating with liquidity and perceived stability, though it's not a direct indicator of future performance.
How does trading volume influence price?
Trading volume indicates the total amount of a cryptocurrency bought and sold over a specific period, typically 24 hours. High volume accompanying a price move (up or down) suggests strong market conviction and broad participation, making the move more significant and potentially sustainable. Low volume, conversely, can indicate a lack of interest or that a price movement is less robust and more susceptible to reversal.
What is the significance of a crypto's 24-hour high and low?
The 24-hour high and low represent the peak and trough prices reached within a single day. These figures are significant because they define the immediate trading range and can act as short-term indicators of support (the low, where buying interest emerged) and resistance (the high, where selling pressure increased). Observing these levels helps gauge daily volatility and potential immediate price barriers.
Should I only look at the current price?
No, focusing solely on the current price provides an incomplete and potentially misleading picture. The current price is merely a snapshot. For informed analysis, it's crucial to consider the current price in conjunction with other metrics like 24-hour change, trading volume, market capitalization, and historical price action, as well as broader market context and news events.